Real frames. Real detections. Measured in millimetres.
Everything below was cut from full-width frames stored by the inspection software on a deployed production line. The outline is the region the engine reported; the size is what it measured. Hover any crop to see the raw fabric without the outline.
Read from the line's inspection database. Lot names, customer and fabric article numbers are withheld.
Eleven grounds from one line — one engine, one configuration.


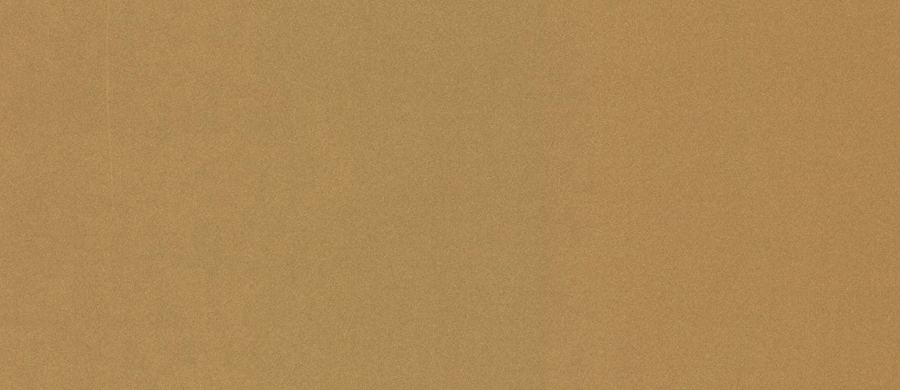

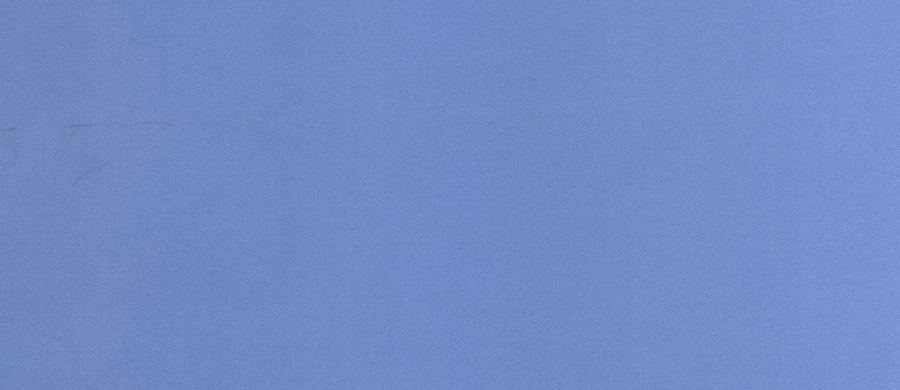

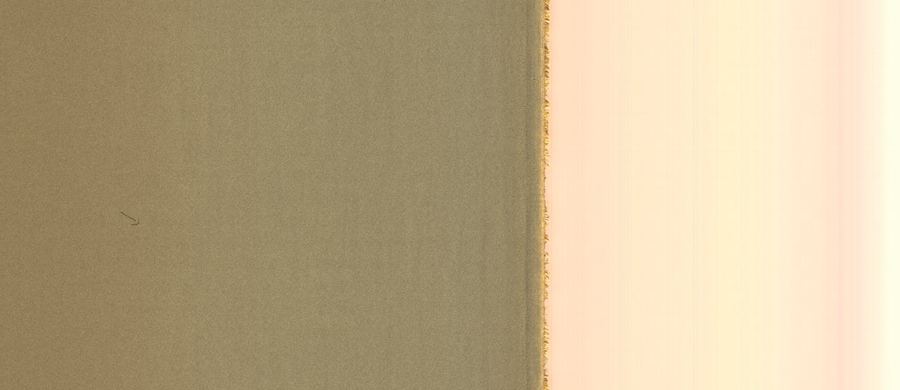

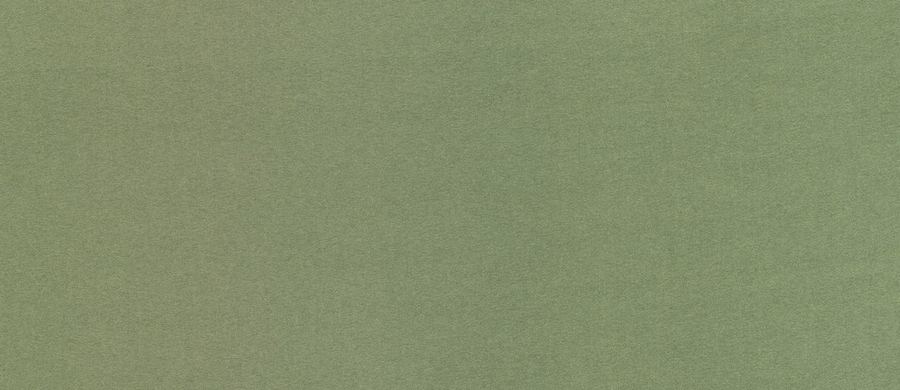


Crops from the centre of one frame per lot, colour as captured after flat-field correction. Dark, saturated and light grounds all run on the same engine with the same configuration; each fabric's reference is built automatically.
The outline
Is the polygon the engine stored for the region, drawn 1:1 on the crop. Not a bounding box, not redrawn by hand.
The size
Width × height in mm from the calibrated pixel scale (0.137 mm/px on this line). "Field" is the width of the crop shown, for scale.
The selection
We chose regions across fabrics and sizes, favouring operator-confirmed ones. We did not choose the easy ones only; several are near the limit of what a person can see on screen.
Twenty-nine real detections, shown by category.
These are some of the categories in this line's scheme. Categories are defined and named by the customer from their own defect images — as many as they need, not a fixed ten.
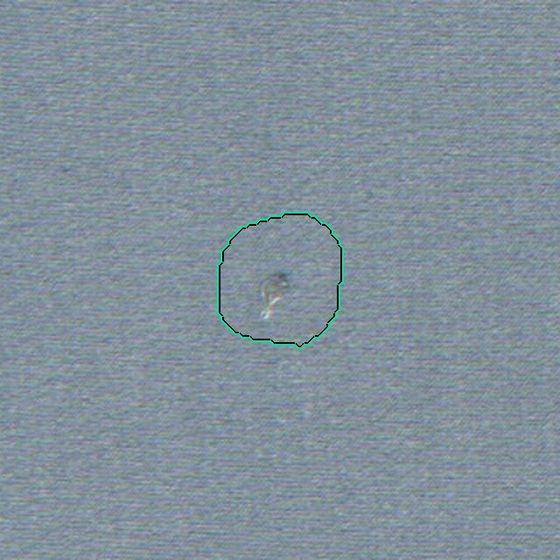
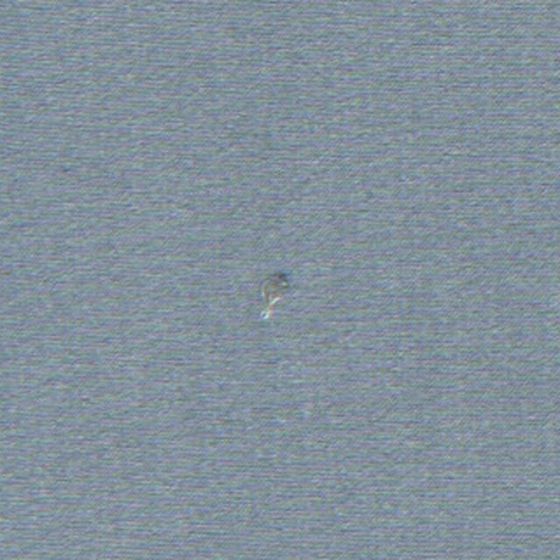
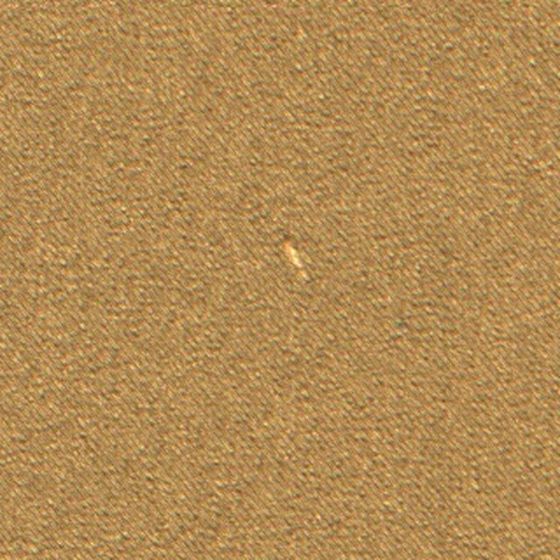
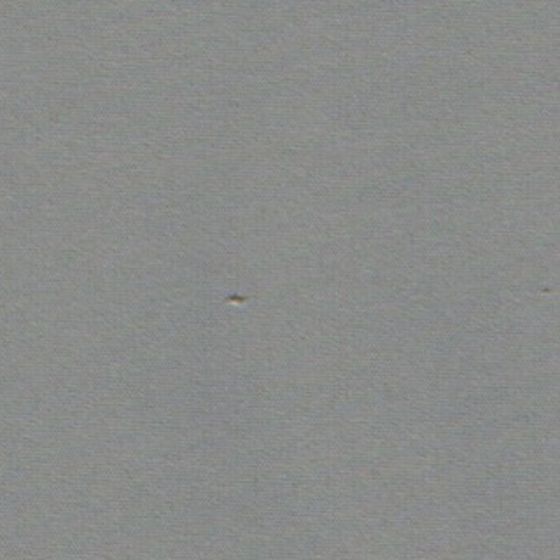
Hole
Holes from 2 mm up, on twill and plain weaves alike.
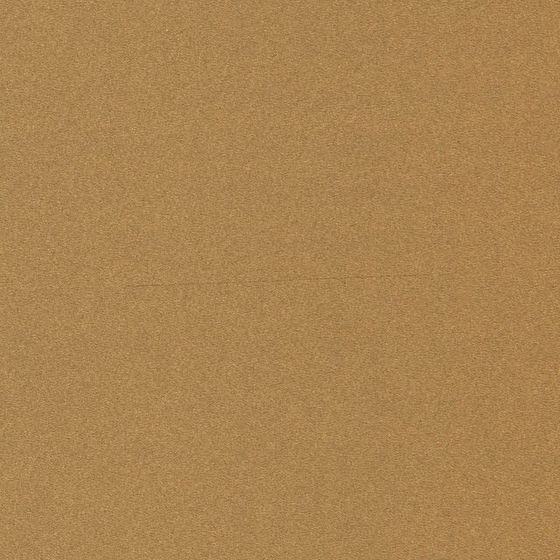
 hover: raw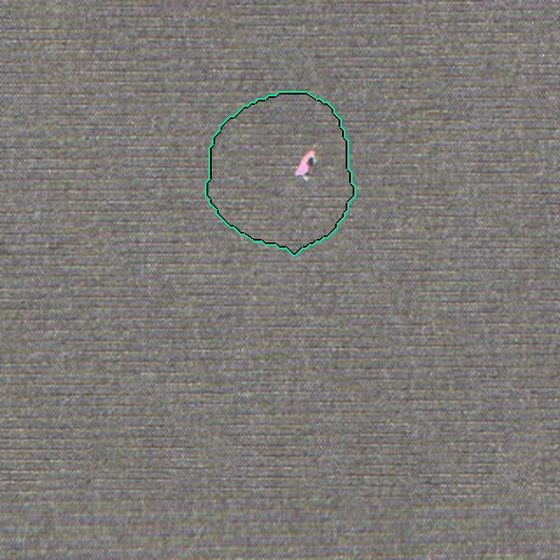
 hover: raw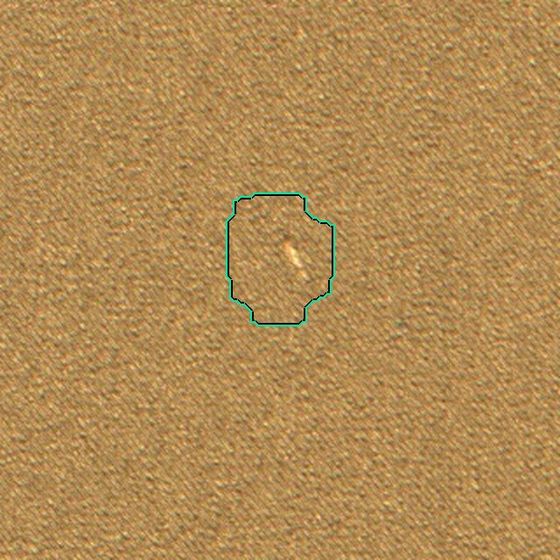
 hover: raw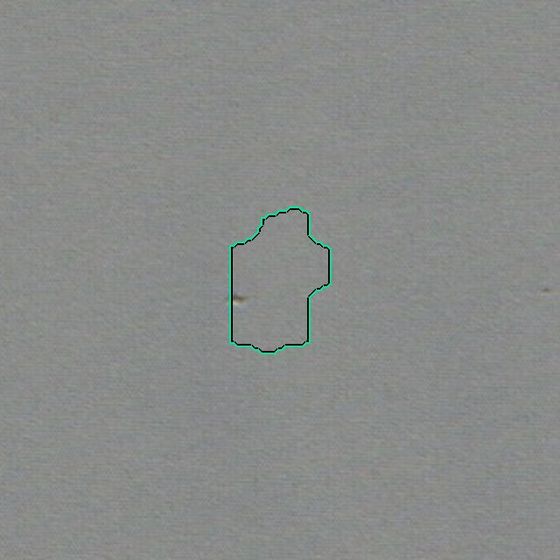
 hover: raw
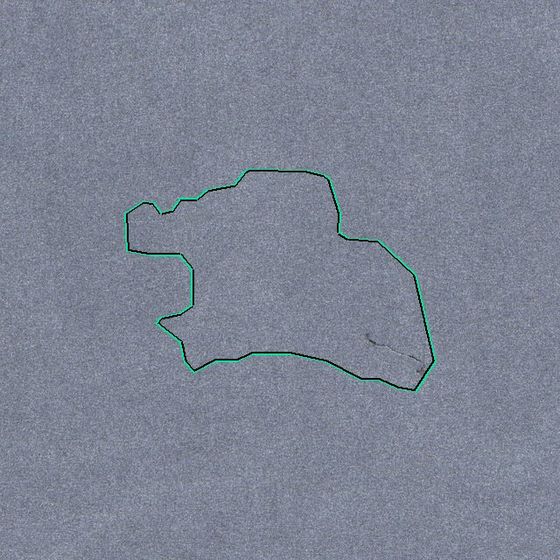
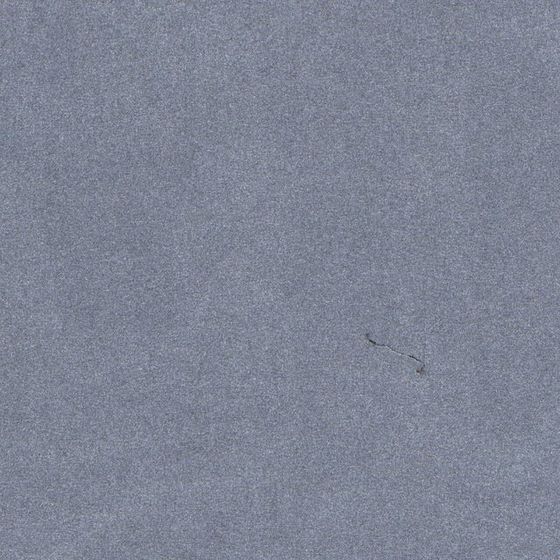
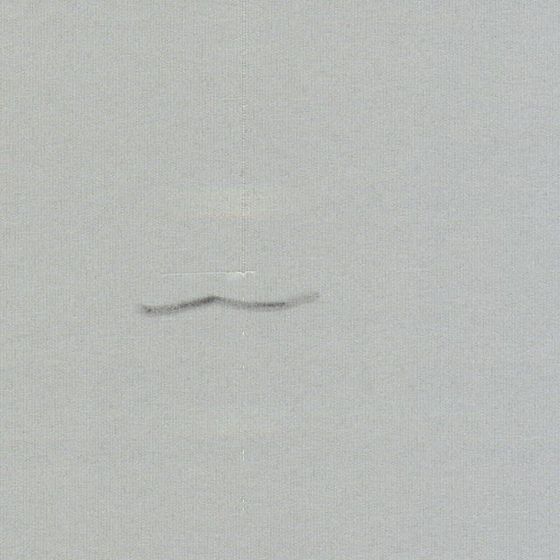
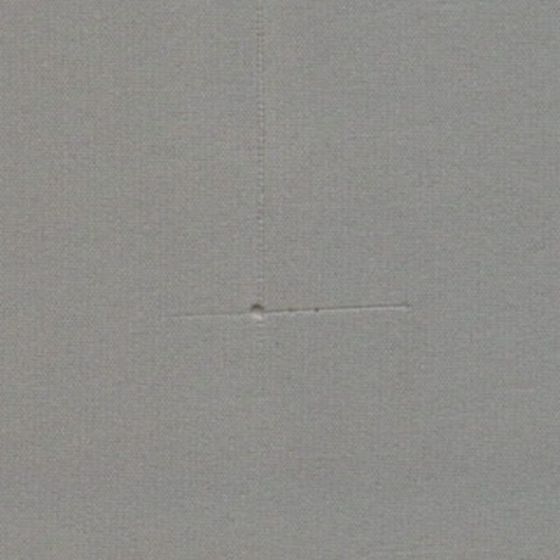
Snag
Pulled or snagged yarn. Often a small pull with a longer distortion around it; the region covers both.
 hover: raw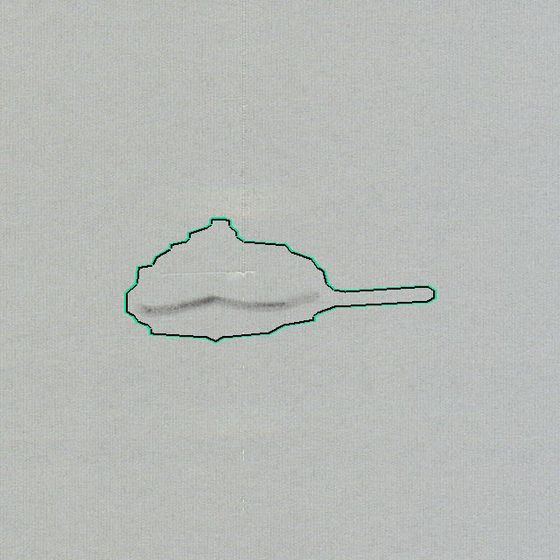
 hover: raw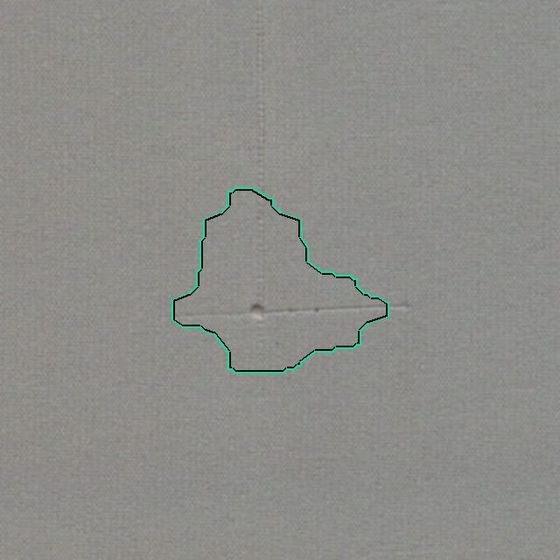
 hover: raw
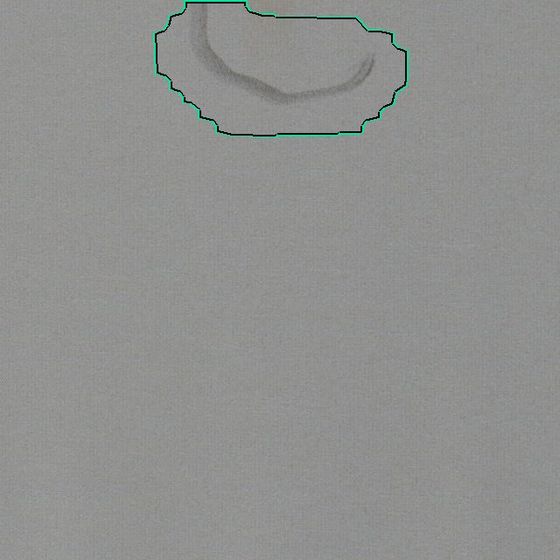
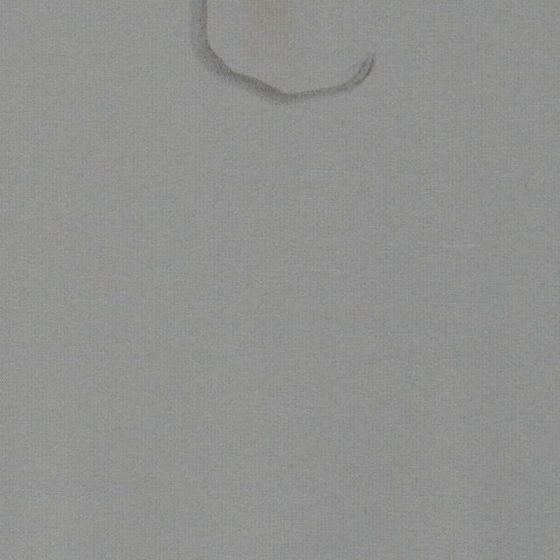
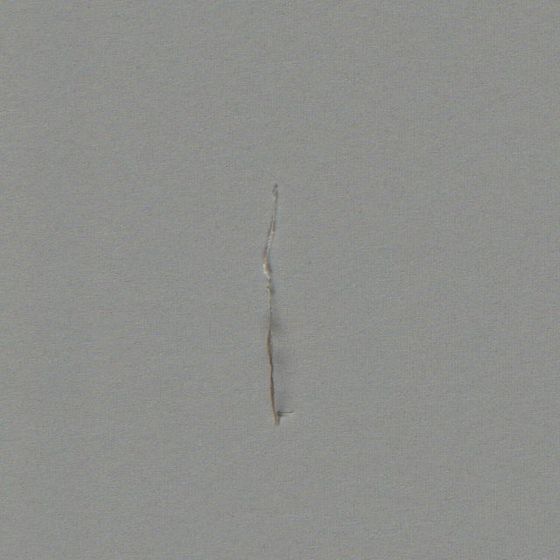
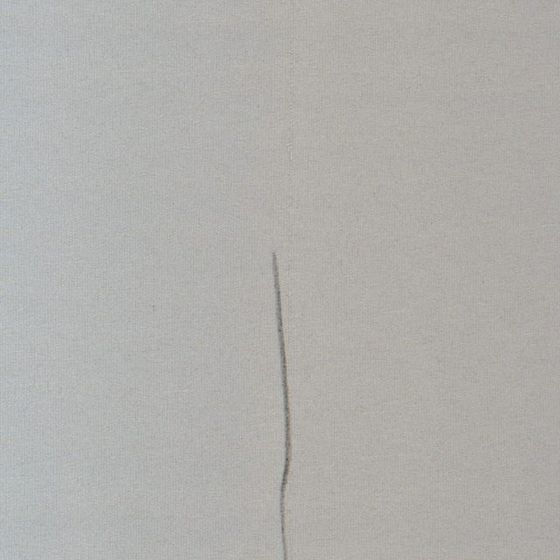
Loose thread
Loose or trailing yarn lying on the surface. Thin, low-contrast, and easy for a tired eye to miss on grey fabrics.
 hover: raw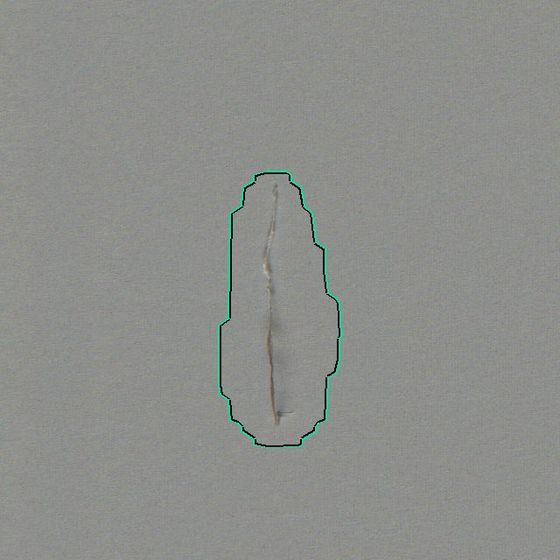
 hover: raw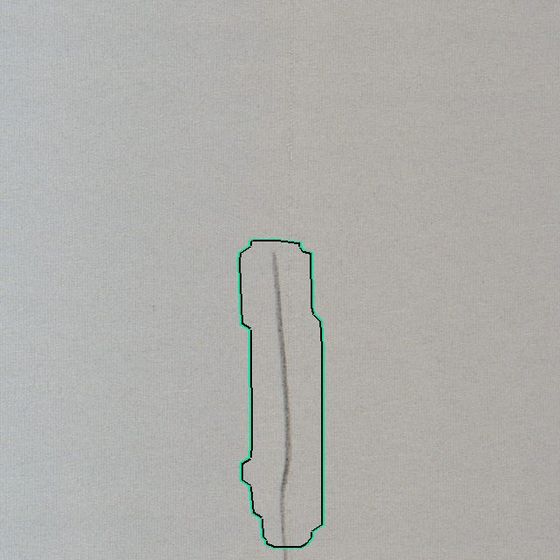
 hover: raw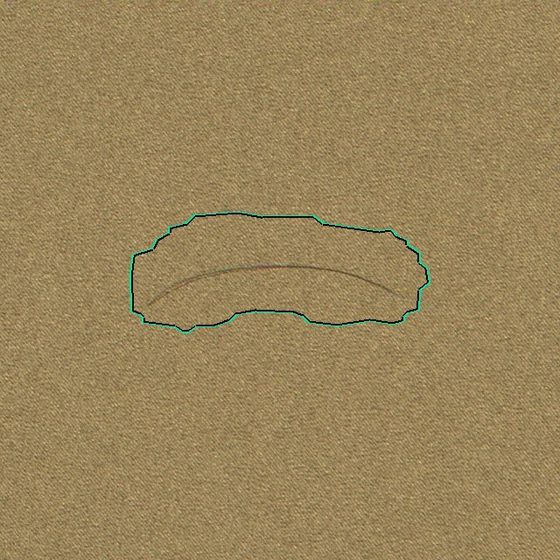
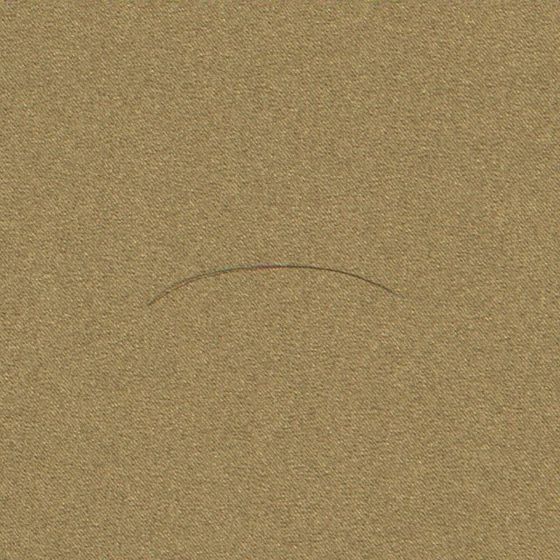 hover: raw
Slub
Knots and slubs of 3–8 mm. Some of the smallest regions the engine reports; the 0.14 mm/px resolution is what makes them visible.
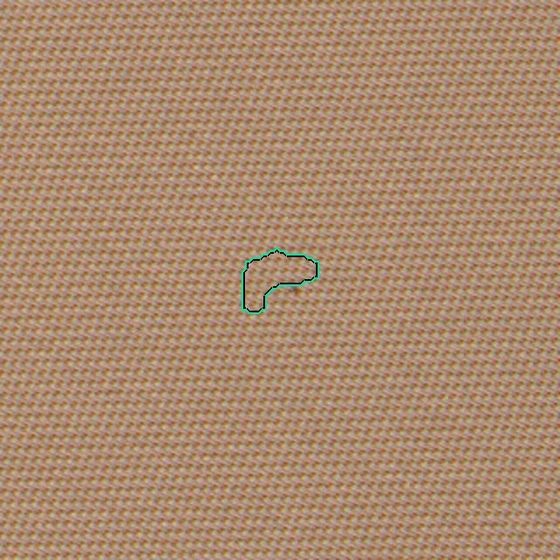
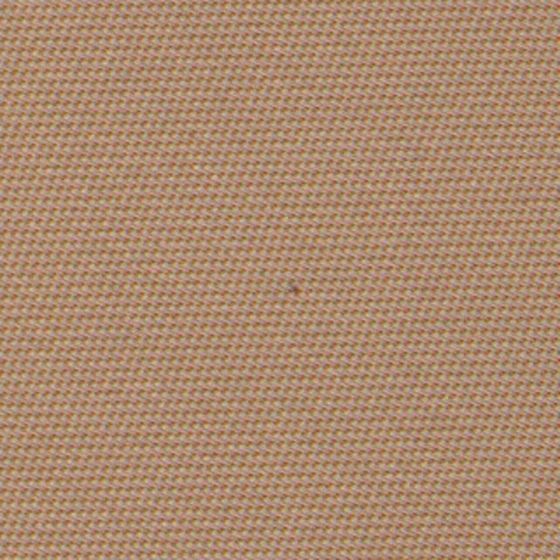 hover: raw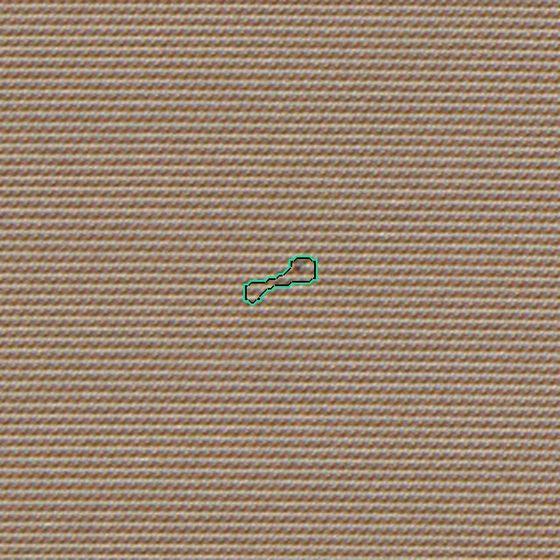
 hover: raw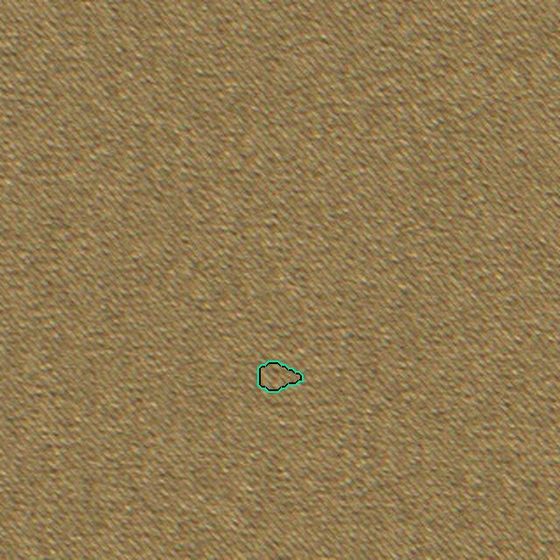
 hover: raw
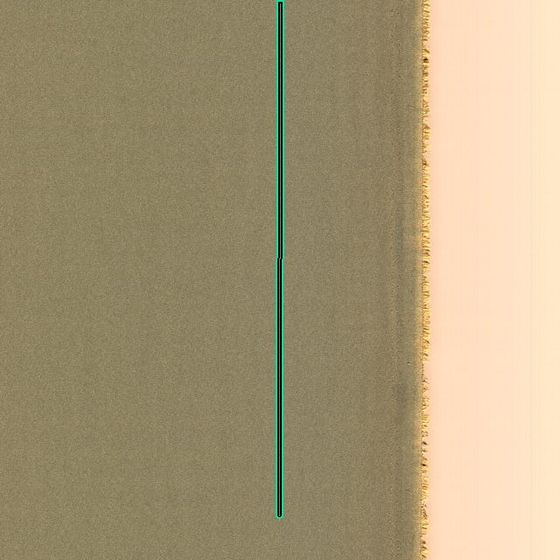
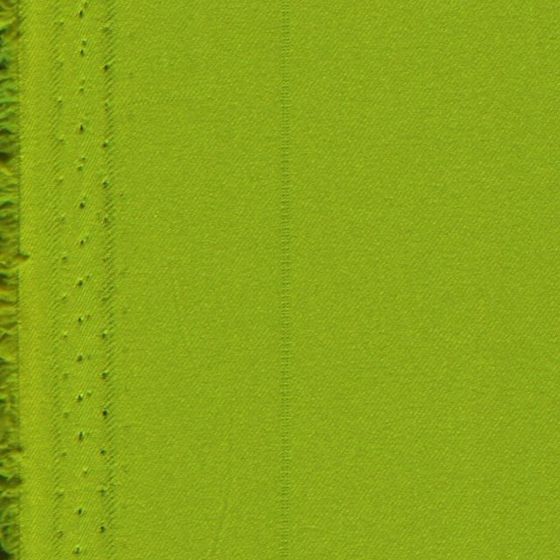
Missing yarn
A missing warp yarn shows as a fine line running with the fabric for hundreds of millimetres. Reported as one region, with its full length.
 hover: raw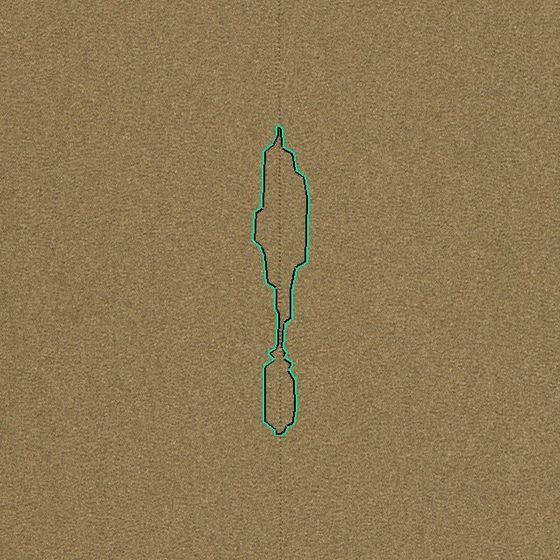
 hover: raw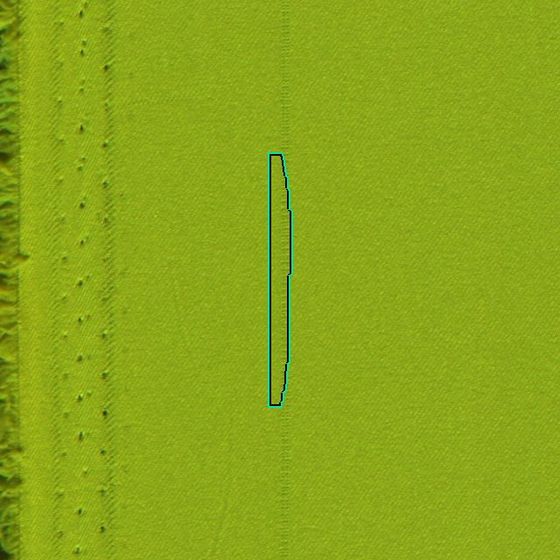
 hover: raw
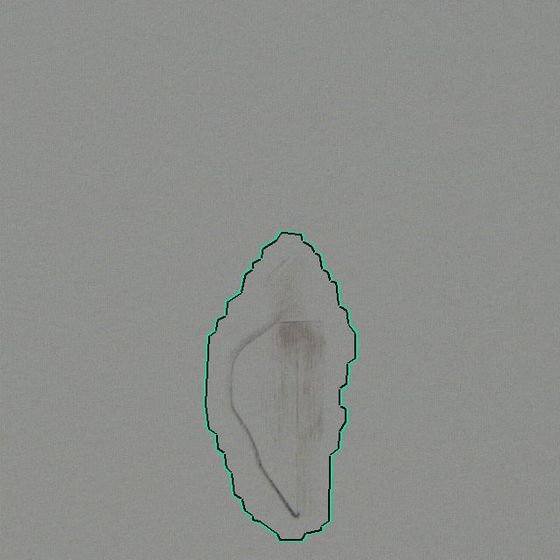
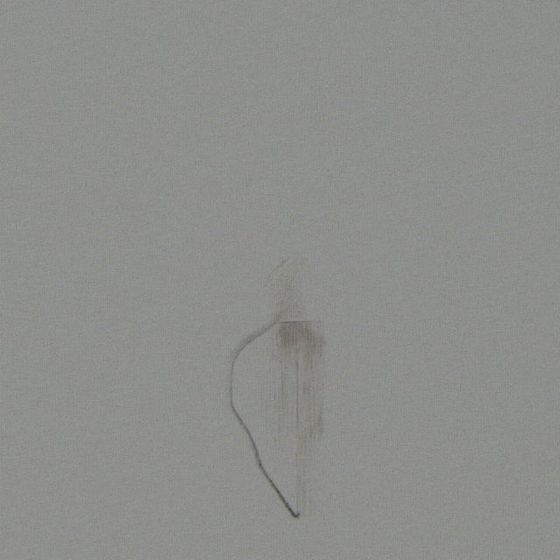
Stain
Oil, grease and handling marks. The outline follows the stained area, not a box.
 hover: raw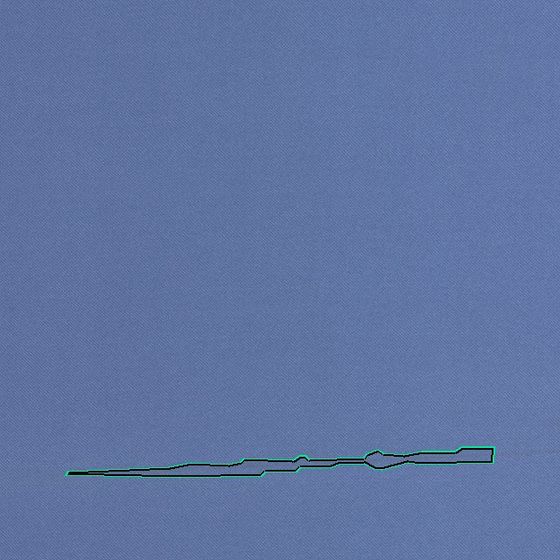
 hover: raw
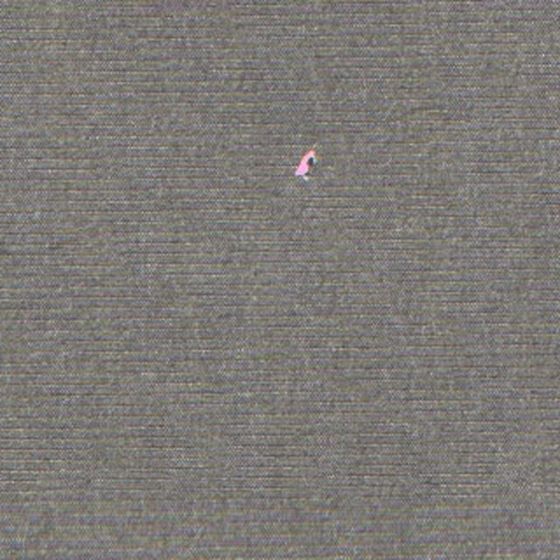
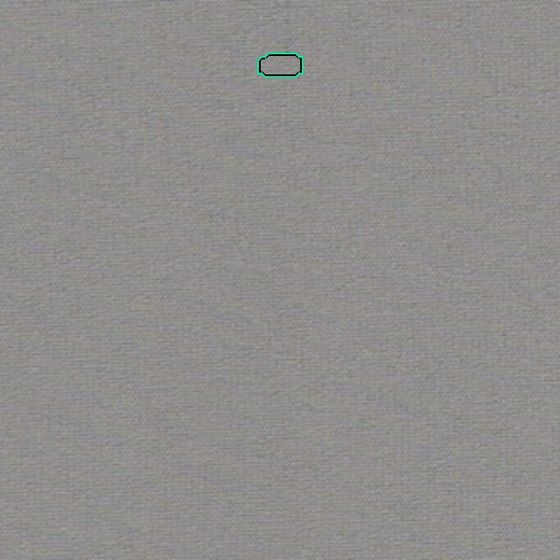
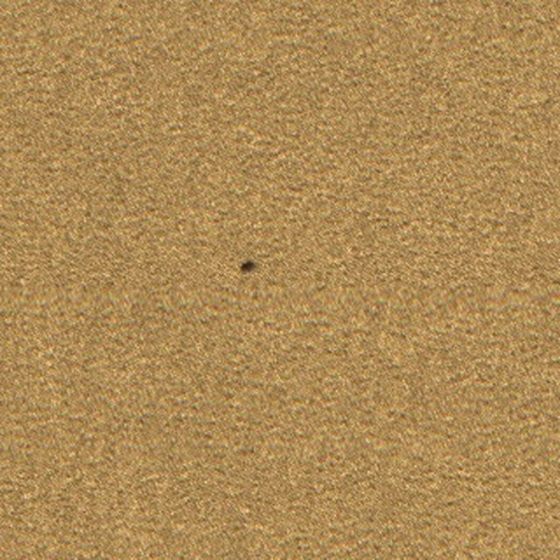
Colour spot
Small spots of foreign colour, 3–20 mm. On bright and dark grounds.
 hover: raw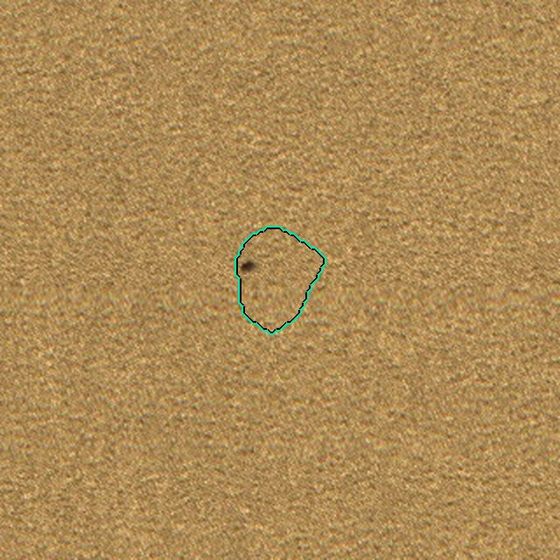
 hover: raw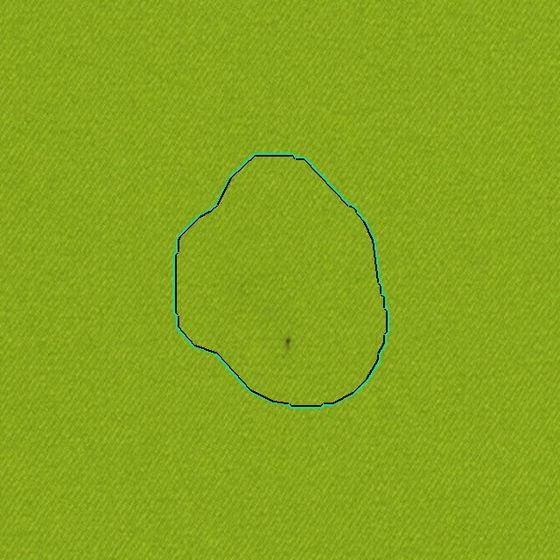
 hover: raw
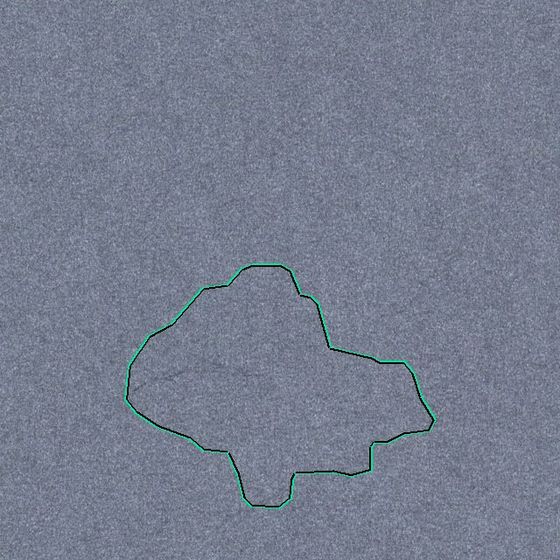
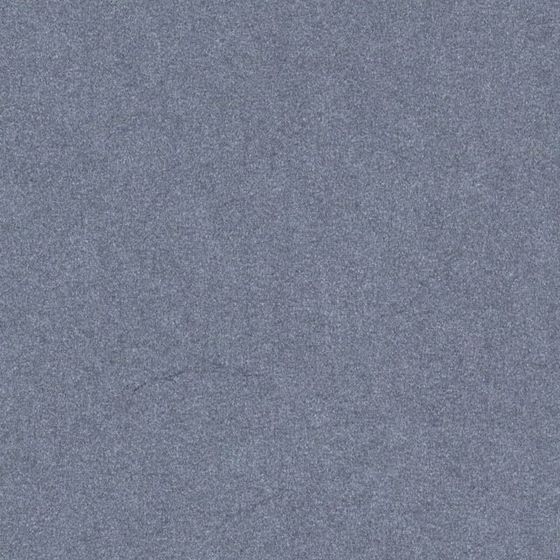
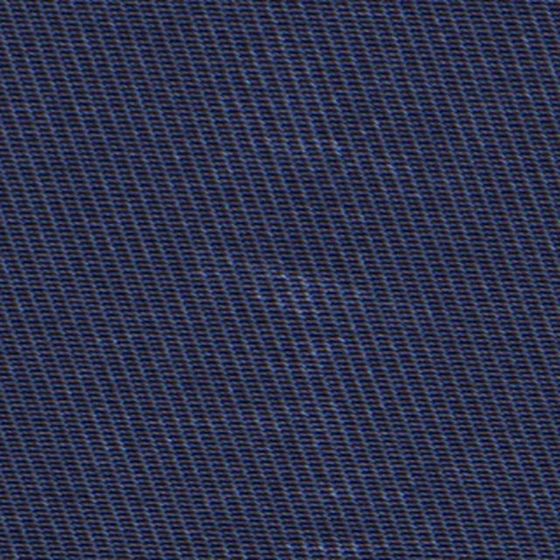
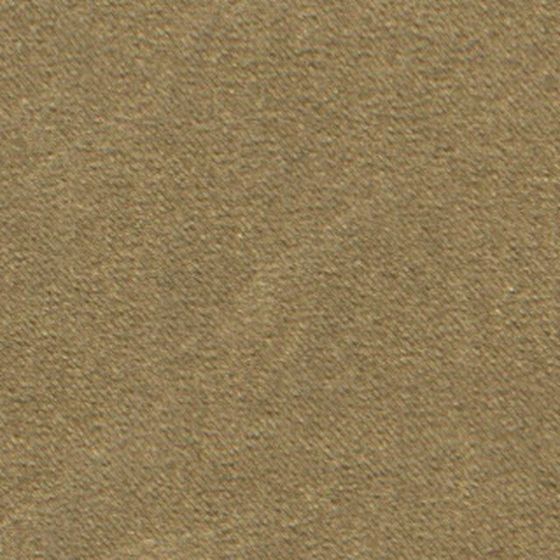
Abrasion
Surface abrasion where the fabric was rubbed. Texture change without a hole.
 hover: raw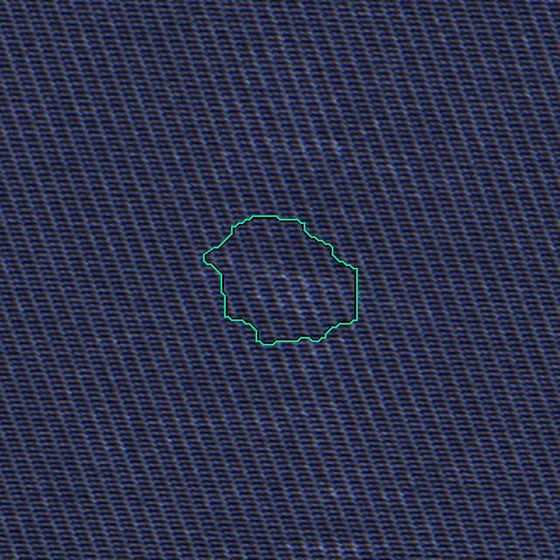
 hover: raw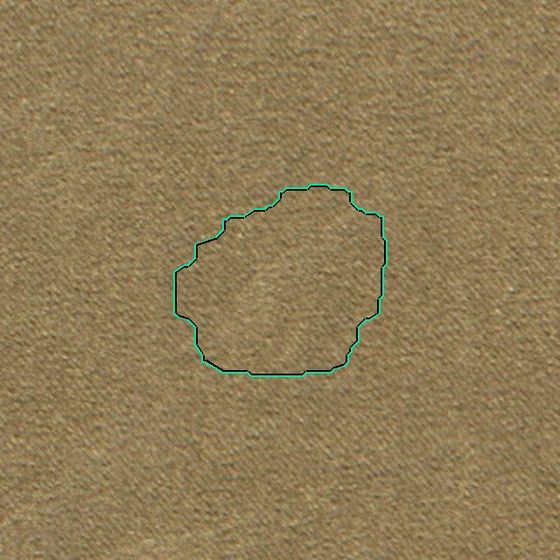
 hover: raw
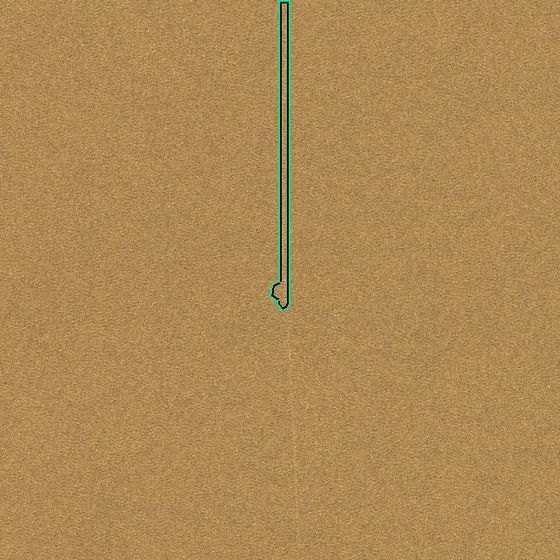
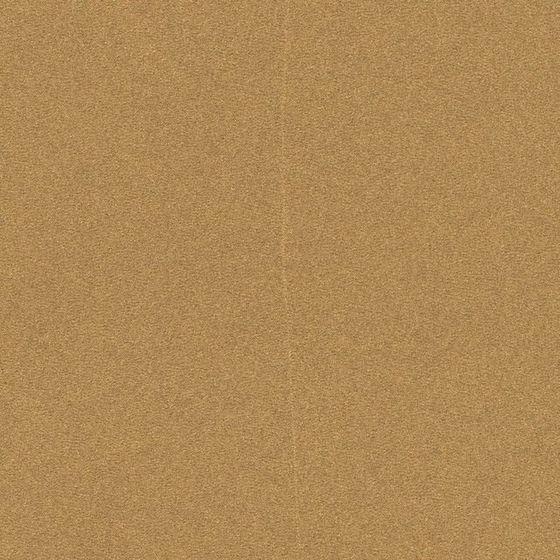
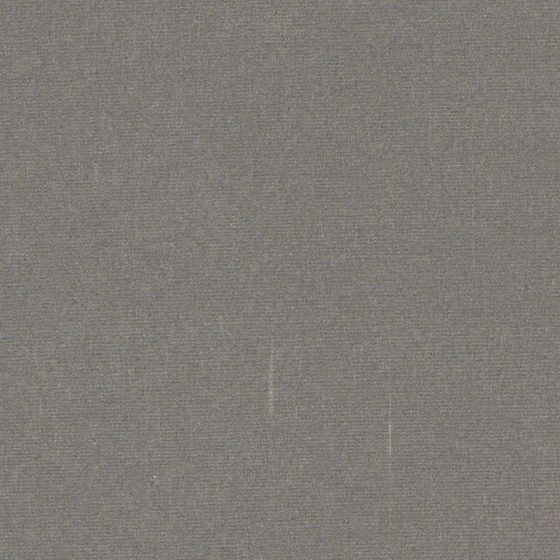
Warp-direction defect
Faults running along the fabric (warp direction). Reported with their length.
 hover: raw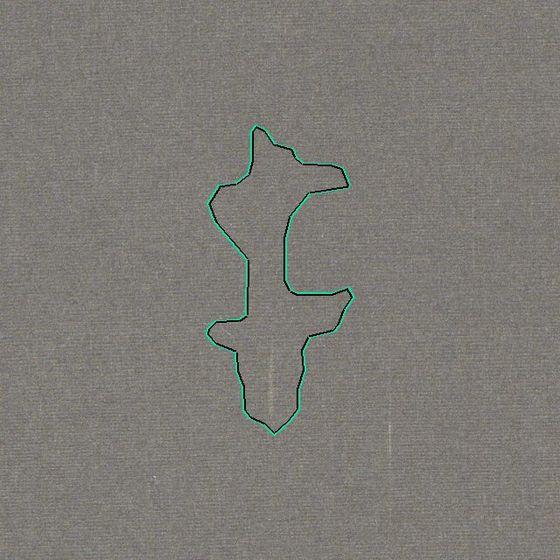
 hover: raw
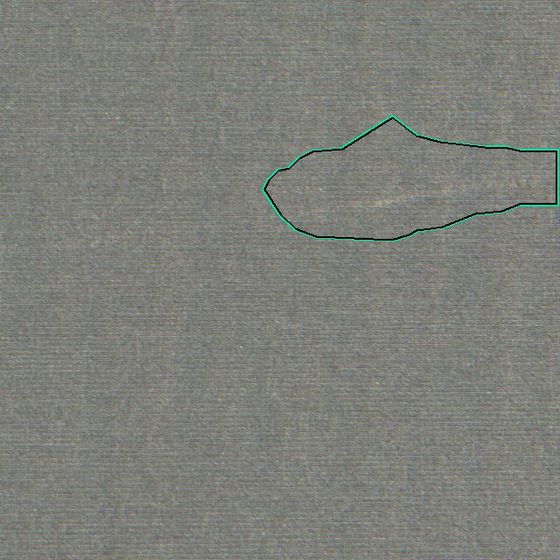
Weft-direction defect
Faults running across the fabric (weft direction).
 hover: raw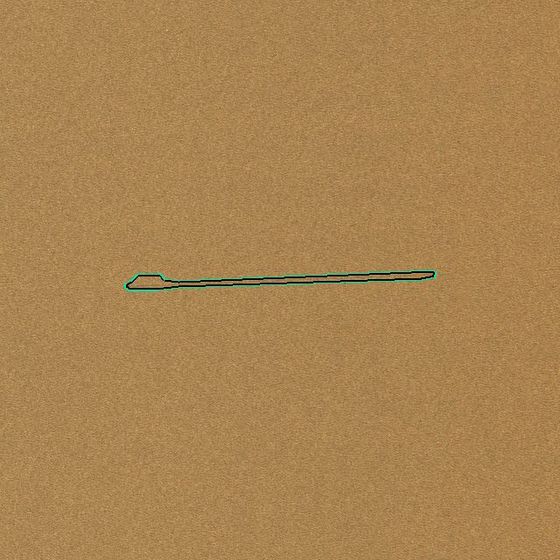
 hover: raw
A 0.21 mm spot, somewhere in 1.5 metres of width.
This is the problem in two pictures. First, what one camera sees across the fabric, with the reported region boxed. Then the same region at sensor resolution, where a person can finally see it.

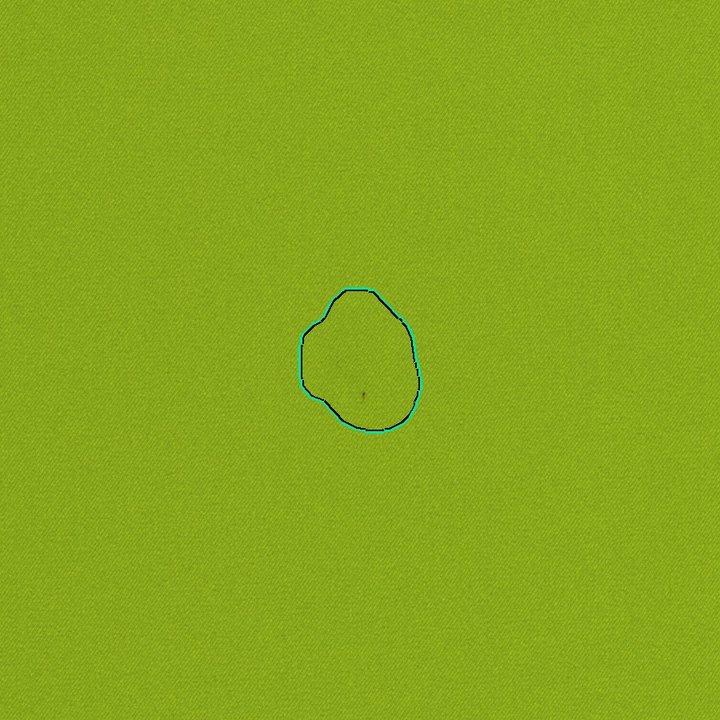
The same region, at sensor resolution.
Colour spot, 21 × 27 mm, outlined as the engine reported it. The window shown is about 125 mm across — roughly one twelfth of the fabric width above. At production speed nobody is looking at this square; the engine looks at every one of them.
Three honest notes.
See it on your own fabric.
Bring the fabric that gives you the most trouble to a pilot machine. We run it and hand back the record — every region, its size, its position and the image it came from.